Create and customize reports
Custom reports are the most flexible way to shape Sandtime.io data around your business questions.
Start with the basics
Open Reports and choose Create new report.
Then define the date range, plus three building blocks: Group by, Metrics, and Filters. You can also add Additional columns.
Group by
Group by determines how rows are broken down. Add dimensions in order - the first one becomes the outer grouping, the next nests inside it.

Metrics
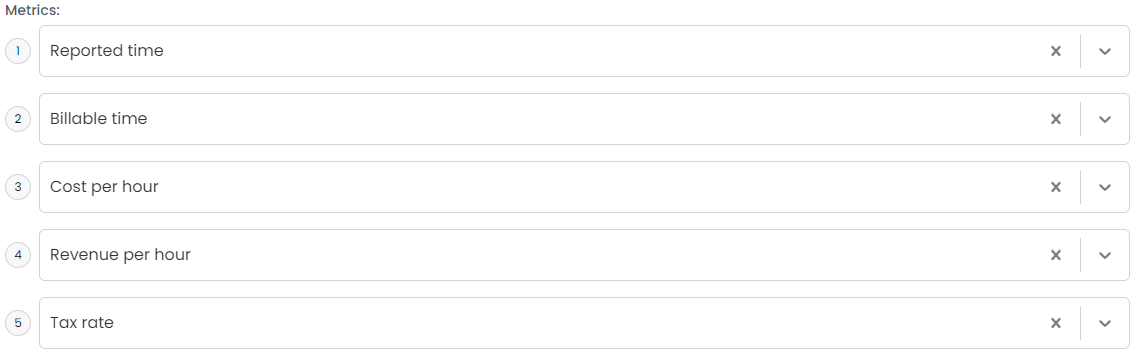
Metrics determine which numbers each row carries, such as reported and billable time or the money side of a project.
Compare reported time with the Goal
Add Goal under Metrics to set reported time against the time the members in the report are expected to work. The Goal follows your core hours: every workday counts as one core-hours day, while weekends count as zero, and so do public holidays when a country is selected in Settings > Time tracking > Holidays.
What a row shows depends on Group by:
- A row grouped by Member shows the Goal of that member.
- A row without a member shows the Goal of the whole team: the Goal of one member times the number of members the report lists, which are the members of its projects, the members who reported time on them, and with the Unassigned project included, every member. Filtering the report to fewer members lowers it.
- A row grouped by Year-Month-Day, Year-Month, or Year covers that day, month, or year, and a month only partly inside the date range counts only its days inside the range. Without a time grouping, a row covers the whole date range.
- Projects and activities have no working time of their own, so their rows show no Goal. A month split into projects shows its Goal in the subtotal of the month instead, even when it lists a single project. When the month is split further, for example by Project and then Member, the month gets a subtotal of its own after its last project, and a report grouped by Project first ends with a Grand total carrying the Goal of every member in it over the date range. On a phone, the report shows a single total at the bottom instead, which carries the Goal of the whole report.
With Goal among the metrics, Hide empty rows keeps the members and workdays that have a Goal but no reported time, so missing time stands out. A report grouped by Year-Month-Day and Member therefore lists every workday of every member, while weekends and public holidays are still hidden.
Filters
Filters narrow the report down to the projects and members you care about. Hide empty rows, a switch just above the report table, removes rows with nothing reported. Show archived is a single switch covering both archived projects and archived members, and it is off by default - so until you turn it on, time reported against either is missing from the report.

Useful examples
- Group by Project to review effort per project.
- Group by Member and Year-Month-Day for monthly timesheets.
- Add Activity when you need line-item detail.
- Add Start time and End time as additional columns when exports should show exactly when work happened.
Prepared reports
Sandtime.io ships three report templates you can use as a starting point and then edit: Invoices, Monthly timesheet, and Project revenue.
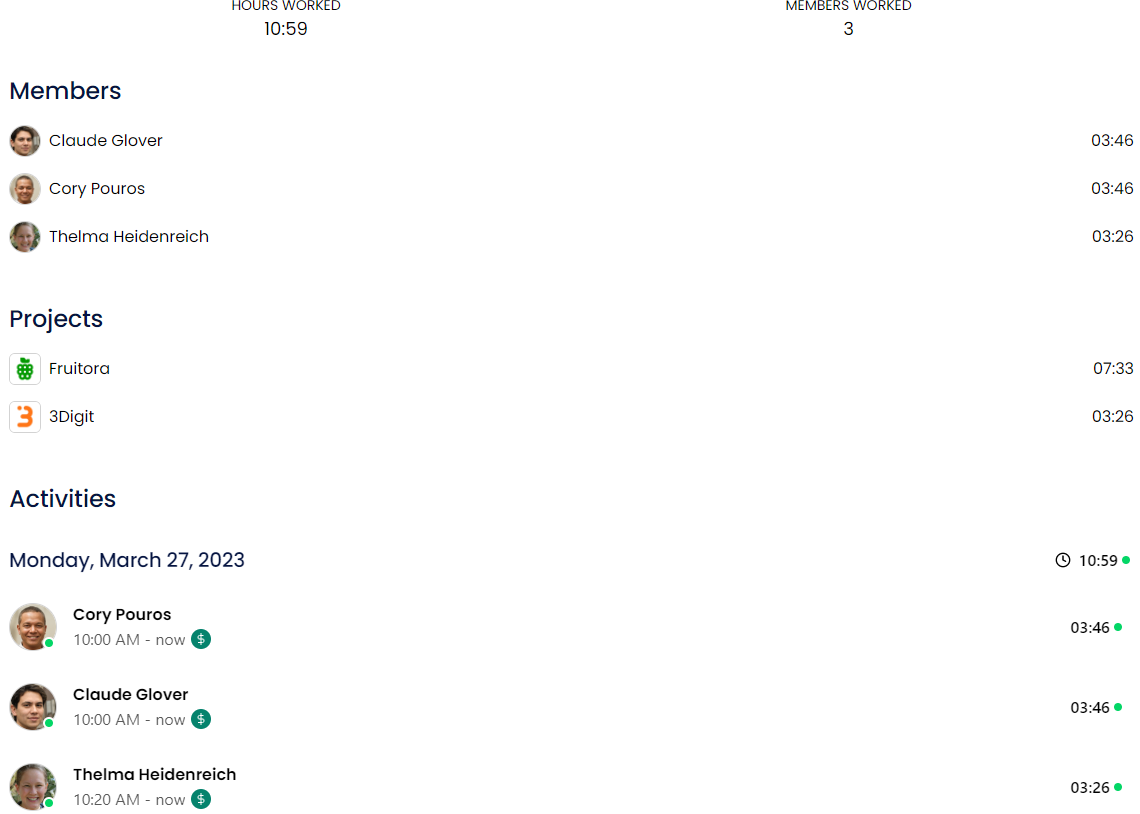
There is also a built-in Summary report that reviews all projects, members, and the time they reported, without any setup.
In what order are projects listed?
In a custom report, projects, members and activities are listed alphabetically at every Group by level, and dates run in calendar order. The Summary report works differently: it lists projects and members by reported time, the busiest first, and only falls back to alphabetical order when two have the same time.
Pin a report to your dashboard
Reports you open often do not need to be hunted down each time. On a report tile, choose Pin to dashboard and it appears on your dashboard for one-click access. Unpin from dashboard removes it again, so the pinned set can follow whatever you are currently watching.
Save the report
If a report will be reused, save it with a clear name. Sandtime.io keeps the selected date-range logic, filters, and columns as part of that saved report definition. See also Print or export itemized reports and Archive and unarchive reports.