40 Time Tracking Statistics for 2026
Your team probably does not have a stopwatch problem. It has a disappearing-work problem. A client call becomes a chat thread. A five-minute fix displaces an hour of planned work. An evening reply never reaches the timesheet. Then invoice or payroll day arrives, and the team has to excavate its own week.
The evidence points to a narrow, useful conclusion: capture enough context to recover work, protect margin, and pay people correctly. Screenshots, activity scores, and constant observation may create more evidence of busyness. They do not automatically create trustworthy time records.
Built to cite, screenshot, and reuse. This is a research digest, not a survey by Sandtime.io. Sources were checked on August 10, 2026.
Research disclosure: Sandtime.io publishes this article and makes time tracking software. None of these findings comes from Sandtime.io customer data. We checked original reports, datasets, papers, and official releases wherever available. Vendor-sponsored surveys are identified, associations stay associations, and our own calculations are labeled as estimates.
Reference matrix: jump to any finding
A number without its population is not a citation. Use the scope column to see who or what was measured before you quote, screenshot, or share a finding.
| Finding | Source / year | Scope / sample | Context |
|---|---|---|---|
| 81% worked on an average weekday | BLS / 2025 data | U.S. civilian population age 15+ | Read finding 1 |
| 8.5 hours on weekdays worked | BLS / 2025 data | U.S. full-time employed people | Read finding 2 |
| 30% worked on an average weekend day | BLS / 2025 data | U.S. employed people | Read finding 3 |
| 5.5 hours on weekend days worked | BLS / 2025 data | U.S. full-time employed people | Read finding 4 |
| 35% worked at home | BLS / 2025 data | U.S. employed people on days worked | Read finding 5 |
| 51% vs 19% worked at home | BLS / 2025 data | U.S. workers age 25+, by education | Read finding 6 |
| 1.27 home-working days per week | Stanford / 2024-2025 | 40,751 responses from college-educated full-time workers, 22-country balanced panel | Read finding 7 |
| 20% globally engaged | Gallup / 2025 data | 141,444 employed respondents, 140+ countries | Read finding 8 |
| $10 trillion modeled productivity loss | Gallup / 2026 | Global economic model | Read finding 9 |
| 48% of employees report chaotic work | Microsoft / 2025 | Work Trend Index survey | Read finding 10 |
| 275 daily pings | Microsoft / 2025 | Highest-notification Microsoft 365 cohort | Read finding 11 |
| 60% of meetings ad hoc | Microsoft / 2025 | Heavy-meeting Microsoft 365 cohort | Read finding 12 |
| 1 in 10 meetings booked last minute | Microsoft / 2025 | Microsoft 365 telemetry | Read finding 13 |
| 30% of meetings cross time zones | Microsoft / 2025 | Microsoft 365 telemetry | Read finding 14 |
| 58 messages arriving outside work hours | Microsoft / 2025 | Average Microsoft 365 user; Monday-Friday, before 9 a.m. or after 5 p.m. | Read finding 15 |
| Late-night meetings up 16% | Microsoft / 2025 | Year-over-year telemetry change | Read finding 16 |
| PowerPoint actions spike 122% before meetings | Microsoft / 2025 | View and edit actions in the final 10 minutes | Read finding 17 |
| 60% of time is work about work | Asana / 2019 | 10,223 knowledge workers across six countries | Read finding 18 |
| 103 hours in unnecessary meetings | Asana / 2019 | Asana annual estimate per knowledge worker | Read finding 19 |
| 209 hours duplicating work | Asana / 2019 | Asana annual estimate per knowledge worker | Read finding 20 |
| 352 hours talking about work | Asana / 2019 | Asana annual estimate per knowledge worker | Read finding 21 |
| 25% of time searching for answers | Atlassian / 2025 | 12,000 knowledge workers and 200 executives | Read finding 22 |
| 87% lack coordination capacity | Atlassian / 2026 | 12,035 workers and 173 executives | Read finding 23 |
| 32% feel constantly watched | ADP / 2025 | Nearly 38,000 workers, 34 markets | Read finding 24 |
| Nearly 3x less likely to report high productivity | ADP / 2025 | Self-reported association | Read finding 25 |
| Almost 4x more likely to report lowest productivity | ADP / 2025 | Self-reported association | Read finding 26 |
| More than 3x more likely to report daily negative stress | ADP / 2025 | Self-reported association | Read finding 27 |
| 83% admit productivity theater | Visier / 2023 | 1,000 U.S. full-time employees | Read finding 28 |
| 43% spend 10+ hours on it | Visier / 2023 | Self-reported weekly time | Read finding 29 |
| 36% attend unnecessary meetings | Visier / 2023 | Self-reported behavior | Read finding 30 |
| 3% reported embellishing a time card | Visier / 2023 | Sensitive self-report; not a prevalence estimate | Read finding 31 |
| 122 studies show mixed surveillance effects | GAO / 2025 | Studies that met GAO’s methodological standards | Read finding 32 |
| Managers lose 6+ hours to automatable admin | UKG / 2026 | 1,400 large organizations | Read finding 33 |
| 32% report weekly system failures | UKG / 2026 | Frontline systems at large organizations | Read finding 34 |
| $259m+ in back wages recovered | U.S. DOL / FY2025 | Nearly 177,000 workers in enforcement cases | Read finding 35 |
| Pay often represents 40-60% of operating expense | UKG/KPMG / 2026 | Report context for large organizations, not a measured survey response | Read finding 36 |
| 2-4% payroll leakage | UKG/KPMG / 2026 | Enterprise labor-spend estimate | Read finding 37 |
| 38% report $1m-$5m losses | UKG/KPMG / 2026 | Large multinational organizations | Read finding 38 |
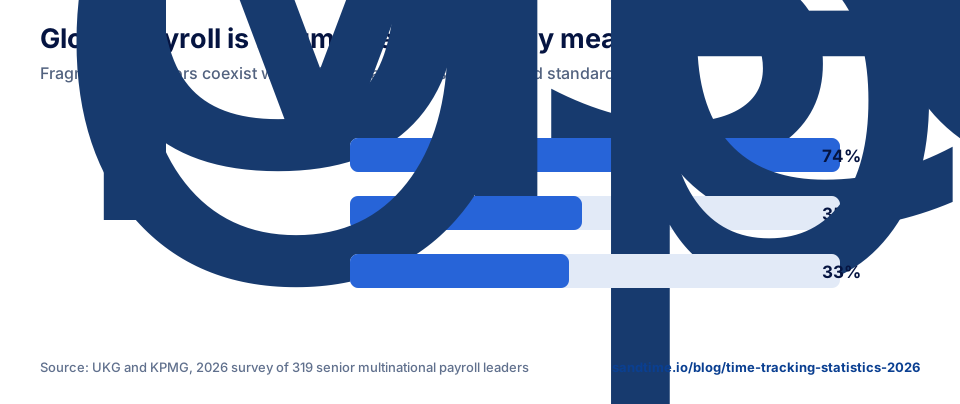
| 74% use more than two payroll vendors | UKG/KPMG / 2026 | Global payroll operations | Read finding 39 |
| 35% measure first-time-right payroll; 33% standardize globally | UKG/KPMG / 2026 | Two separate controls in the same respondent group | Read finding 40 |
How to quote a statistic without breaking it
The safe-citation rule: if the number travels, its population, period, and source should travel with it. Link to the stable topic anchor, not a statistic number, so a future source update does not break your reference.
Government statistics
Best for population-level work patterns and enforcement outcomes. Definitions are precise, but enforcement recoveries are not prevalence estimates.
Academic research
Best for cross-country patterns and carefully specified populations. A result for college-educated full-time workers is not a result for every worker.
Product telemetry
Best for observed digital behavior at scale. Cohort selection matters: Microsoft’s two-minute and 275-ping figures use different windows and high-volume cohorts.
Sponsored surveys
Useful for attitudes and operational benchmarks, but self-report and sponsor incentives require caution. ADP, Visier, Asana, Atlassian, and UKG findings are labeled accordingly.
Six operating benchmarks to test against your own records
One number will not tell you whether time tracking works. These six expose different leaks: hours never entered, captured work that never becomes billable, manager time lost to corrections, days too fragmented for sustained work, time data that arrives too late to change a project, and utilization ratios whose meaning changes with the denominator. Keep each study’s population and definition attached, then ask whether the same leak appears in your own records.
Run the comparison on your own evidence: quantify billable leakage, run the time-tracking health check, and price the interruptions you can verify with the meeting cost calculator.
Start with the decision on your desk: choose your role below instead of reading all 40 findings in order.
Work does not stay inside the boxes on a schedule
A policy may define a five-day week, an eight-hour day, and one workplace. The data describes something messier: substantial weekend shifts, work finished at home, and access to hybrid work divided sharply by education and occupation.
1. 81% of employed people worked on an average weekday.
Four out of five employed people worked on a typical weekday. The missing fifth is why this number should never be mistaken for an attendance target. The BLS 2025 American Time Use Survey covers the U.S. civilian noninstitutional population age 15 and over, including schedules that look nothing like office hours. It measures whether work happened that day, not whether a timesheet was complete.
2. Full-time workers averaged 8.5 hours on weekdays they worked.
The average worked weekday already runs 30 minutes past the neat eight-hour box. But the denominator is the real story: BLS counted only weekdays on which full-time employees actually worked. This is the length of a worked day, not an average diluted by leave, holidays, and days off.
3. 30% of employed people worked on an average weekend day.
The labor week does not end on Friday. Nearly one in three employed people worked on an average Saturday, Sunday, or holiday. A record that closes with the office can miss a material slice of the week, including potential overtime.
4. Full-time workers averaged 5.5 hours on weekend days they worked.
Weekend work was not a five-minute inbox check. Among full-time employees who worked that day, it averaged five and a half hours - a substantial shift. The qualification matters: BLS did not spread those hours across every full-time worker.


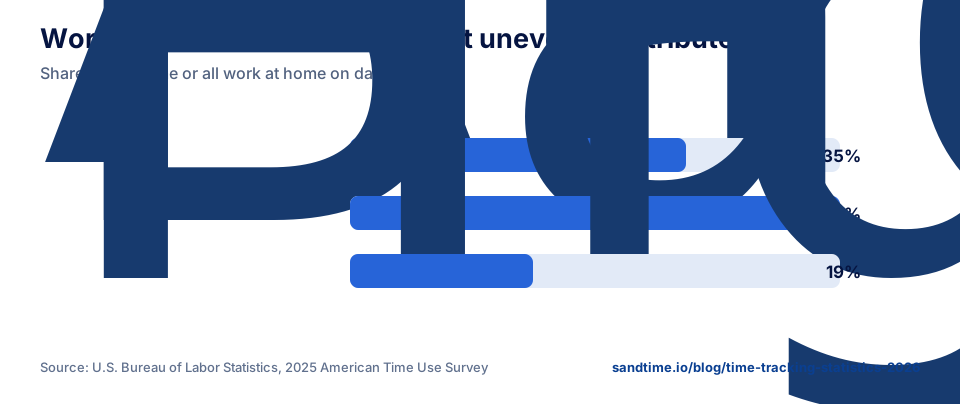
5. 35% of employed people did some or all of their work at home on days worked.
This is a location statistic, not a remote-job count. Someone who finished one task at home sits in the same 35% as someone who worked there all day. It is strong evidence that work has become hybrid, not a census of fully remote jobs.
6. 51% of degree holders worked at home, compared with 19% of people with high school education and no college.
The hybrid-work divide is 32 percentage points. Degree holders were about 2.7 times as likely to do some work at home as people with high school education and no college. The BLS comparison covers employed people age 25 and over. A remote policy designed only around laptop work can therefore misread most of the jobs it is meant to govern.

BLS sample limitation: the 2025 estimates use about 6,100 interviews. ATUS operations stopped during the federal shutdown from October 1 through November 12, leaving no diaries for September 30 through November 11. BLS reweighted later fourth-quarter diaries to represent the missing days and says the effect on the estimates cannot be quantified.
7. Global work from home stabilized at 1.27 days per week.
Hybrid work has stopped looking like a temporary detour. At 1.27 days, home working occupies roughly one-quarter of a five-day week. In Working from Home in 2025: Five Key Facts, Nicholas Bloom bases the trend on 40,751 responses from college-educated full-time workers in a balanced 22-country panel. A separate latest-wave snapshot covers 16,422 comparable workers in 40 countries. These samples describe graduate office work well; they do not describe the entire labor force.
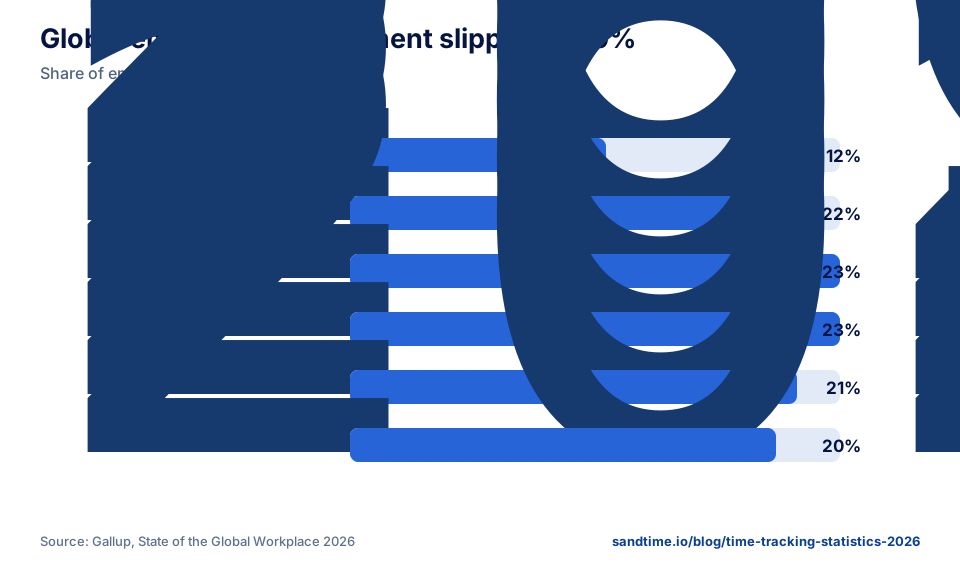
8. Global employee engagement fell to 20% in 2025.
Only one employee in five met Gallup’s definition of engaged. Engagement measures a relationship with work, not tasks completed or hours logged. State of the Global Workplace 2026 draws on 141,444 employed respondents across more than 140 countries and territories. The sample gives the finding global reach; it does not turn engagement into measured output.
9. Gallup modeled the global productivity cost of low engagement at $10 trillion.
$10 trillion is memorable precisely because it is enormous, and dangerous precisely because it sounds like an invoice. It is the output Gallup’s economic model associates with low engagement worldwide, not a ledger total gathered from employers. Cite it as a modeled macroeconomic cost, never as a measured line in a company budget.

Put the benchmarks to work: compare working-time rules, count working days, document remote-work expectations, or start a clean project record.
A full calendar can still hide half the work
Meetings are only the visible blocks. Preparation, follow-up, context switching, answer hunting, and late-night clean-up spill into the gaps. That invisible coordination is where a surprising amount of time - and billable margin - disappears.
10. 48% of employees and 52% of leaders say work feels chaotic and fragmented.
Chaos is not merely an employee complaint. Leaders report it even more often. Microsoft’s 2025 Work Trend Index special report combines a global survey with aggregated Microsoft 365 telemetry. The survey cannot put a duration on chaos, but it shows that fragmentation reaches the people doing the work and the people directing it.
11. Microsoft’s highest-notification cohort receives 275 pings per day.
At 275 pings, the busiest workday becomes an alert-delivery system with tasks squeezed between signals. This is Microsoft’s highest-notification fifth, not the typical user, and notifications arrive in bursts rather than evenly. The often-paired “every two minutes” figure uses core hours and a different analytical window. Combining the two would manufacture a statistic Microsoft did not report.
12. 60% of meetings are ad hoc for Microsoft’s heaviest meeting users.
For heavy meeting users, the calendar is not a plan. It is a document rewritten all day: six meetings in ten were added ad hoc. A Friday timesheet rebuilt from meeting blocks will miss preparation, follow-up, and the task pushed aside by each sudden call. The 60% describes the heaviest meeting cohort, not every Microsoft 365 user.
13. One in 10 scheduled meetings is booked at the last minute.
One meeting in ten arrives with almost no planning runway. Its cost begins before anyone joins: the current task must be paused, moved, or finished later. A calendar can record the meeting perfectly while losing the disruption around it.
14. 30% of meetings span multiple time zones.
One organizer’s 3 p.m. can be another participant’s evening. With almost one meeting in three crossing time zones, the calendar’s displayed hour is a poor account of everybody’s working day. Keep local timestamps and explicit working-time records, especially when after-hours work matters for policy or pay.
15. An average Microsoft 365 user had 58 messages arrive before or after standard work hours; after-hours chats sent were up 15% year over year.
The workday now has an inbox-shaped shadow. For the average user, 58 messages arrived before 9 a.m. or after 5 p.m., while chats sent outside those hours rose 15%. Microsoft calculated both signals over rolling 28-day periods. An incoming message creates pressure, not proof of labor, so notification logs cannot substitute for time records.
16. Meetings after 8 p.m. increased 16% year over year.
Night meetings are growing, not necessarily common: 16% is the year-over-year increase, not their share of all meetings. That distinction preserves the statistic without softening the warning. Break the pattern down by team and time zone before late availability hardens into an unwritten job requirement.
17. PowerPoint view and edit actions spike 122% in the final 10 minutes before meetings.
The final ten minutes before a meeting are a preparation traffic jam. PowerPoint views and edits surge 122% compared with earlier fixed pre-meeting windows, based on rolling 28-day totals per participant. This is not year-over-year growth, and frantic editing is not evidence of good preparation. It is evidence that work is bunching at the deadline.


18. Knowledge workers spend 60% of their time on “work about work.”
The headline is 60%. The useful number is the 40% left behind. In Asana’s breakdown, only 27% remains for skilled work and 13% for strategic planning after status updates, information searches, priority changes, and other coordination. The 2019 Anatomy of Work Index was a Sapio Research survey for Asana of 10,223 knowledge workers in six countries.
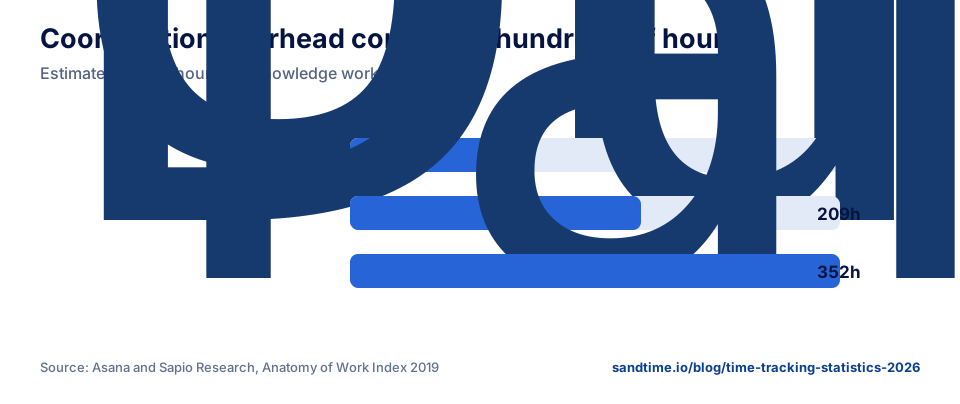
19. Unnecessary meetings consume an estimated 103 hours per worker per year.
The annual estimate converts meeting fatigue into a capacity decision: 103 hours equals roughly two and a half 40-hour weeks per worker. That is enough reason to audit recurring meetings, not permission to book the same loss in your own forecast. Asana’s published breakdown is a vendor estimate; the meeting cost calculator produces a figure from your own attendance and salaries.
20. Duplicative work consumes an estimated 209 hours per worker per year.
Duplicated work can look perfectly productive while destroying value. The estimate equals more than five 40-hour weeks spent recreating something that already exists. Asana’s original release independently describes duplication as more than 10% of work time and more than 200 hours a year, supporting the scale of the 209-hour breakdown. For client teams, that is a direct route to billable leakage.
21. Talking about work consumes an estimated 352 hours per worker per year.
At 352 hours, the estimate approaches nine 40-hour weeks. The answer is not nine weeks of silence. It is fewer conversations whose only purpose is to locate an owner, recover a decision, or ask for status again. Treat this vendor estimate as a workflow-audit prompt, not a target for cutting collaboration.

22. Surveyed knowledge workers and executives report losing 25% of their time searching for answers.
An eight-hour day with a 25% search tax leaves two hours for locating information before anyone can act on it. Atlassian’s State of Teams 2025 reports the self-estimate from 12,000 knowledge workers and 200 executives. Because Atlassian sponsored the survey, the most useful response is not belief or disbelief. It is a stopwatch: how long does a routine answer take to find in your team?
23. 87% of knowledge workers say they lack enough time and capacity to coordinate across teams.
Coordination is often budgeted as if it will happen in the margins. Eighty-seven percent say those margins are already gone. Atlassian’s State of Teams 2026 surveyed 12,035 knowledge workers and 173 Fortune 1000 executives. Software may organize the load, but a self-reported capacity gap is not proof that another tool can create time.
Replace the benchmark with your numbers: price a meeting, estimate billable leakage, test project profitability, or build a better time log.
When visibility becomes the goal, people perform visibility
Monitoring promises certainty. The evidence is less comforting: perceived surveillance travels with stress and lower self-rated productivity, while employees learn to produce the signals the system rewards. More observable activity is not the same thing as more useful work.
24. Nearly one-third of workers say their employer constantly watches them.
Surveillance does not have to be technically classified to change behavior. Almost one worker in three feels watched all the time. ADP Research’s People at Work 2025 surveyed nearly 38,000 workers in 34 markets. The result measures the employee experience, not an audit of installed software.
25. Workers who feel watched are nearly three times less likely to report high productivity.
The monitoring paradox begins at the top of the scale: people who feel watched are much less likely to rate their productivity highly. Both variables are self-reported, so this is an association, not proof that monitoring caused a fall. Any business case for more observation still has to explain that contradiction.
26. Workers who feel watched are almost four times more likely to report the lowest productivity.
The bottom of the scale moves even more sharply. Workers who feel watched are almost four times as likely to place themselves in the lowest-productivity group. Job type, culture, or poor management could influence both answers. Even with that caveat, the result is hard to fit into a simple “monitoring improves output” story.
27. Workers who feel watched are more than three times more likely to report negative stress every day.
Stress is the bill that an activity dashboard does not show. ADP found a greater-than-threefold association with daily negative stress among workers who felt watched. This is neither a clinical diagnosis nor a causal experiment. It is a management test: does the information collected improve a real decision enough to justify the tension it may create?


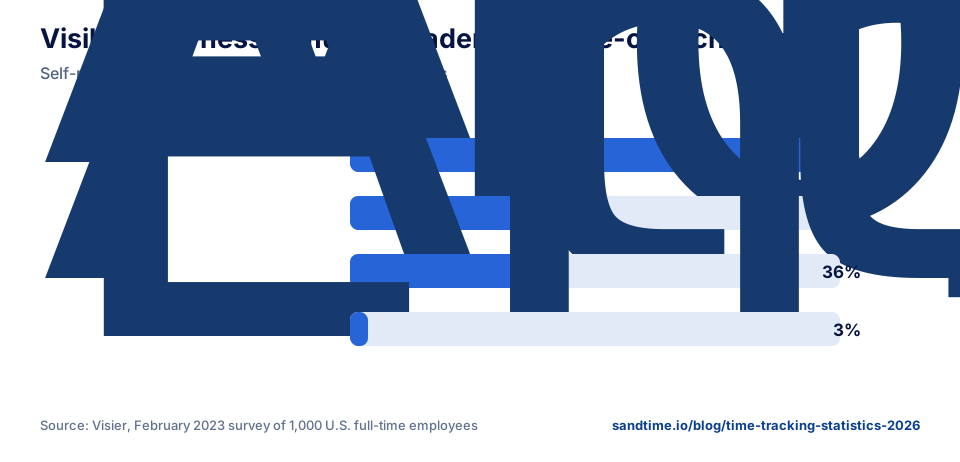
28. 83% of employees admit to at least one form of productivity theater.
When 83% admit at least one performative behavior, productivity theater is not a character flaw at the edge of the workforce. It is a response to incentives. Visier’s 2023 survey asked 1,000 U.S. full-time employees about the previous 12 months. The umbrella figure means at least one behavior, not constant performance by every respondent.
29. 43% say productivity theater takes more than 10 hours per week.
Ten hours is more than one-quarter of a 40-hour week. If the estimate is even directionally right, looking busy can consume a full working day before useful output begins. Respondents estimated the time themselves, so this is not observed duration. Read it as an incentive alarm, not a precise time ledger.
30. 36% attended an unnecessary meeting to appear engaged.
More than one in three respondents spent time in a meeting they considered unnecessary because absence looked risky. That turns “too many meetings” from a calendar complaint into a management problem. Reward visible presence as commitment, and people will rationally optimize for visible presence.
31. 3% reported embellishing a time card in the previous 12 months.
The 3% is strikingly small beside the 83% umbrella figure, but it answers a far more sensitive question. Falsifying a time record can carry consequences, making underreporting plausible. The defensible wording is “3% admitted it,” not “only 3% do it.” This is not a prevalence estimate for time-card falsification.

32. A U.S. GAO review found mixed effects across 122 studies that met its methodological standards.
The broadest evidence review refuses the easy verdict. The Government Accountability Office retained 122 studies published from 2020 through 2024 that met its methodological standards, while still documenting limitations. Outcomes for health, safety, and employment varied with the technology, purpose, and safeguards. “It depends” is not evasive here. It is the finding.
Audit trust before adding more tracking: test the process, write a clear policy, and use timesheets that record work without recording workers.
Payroll failures start upstream, long before payday
Time data passes through managers, systems, approvals, payroll providers, and controls before it becomes an invoice or a paycheck. Every handoff is a chance to lose context. At enterprise scale, routine friction becomes a seven-figure control problem.
33. Managers spend more than six hours a week on automatable administration.
Six hours sounds manageable until it repeats 52 times. The illustrative annual total exceeds 300 hours, or about 39 eight-hour days. UKG’s Optimising Workforce Operations 2026 study puts the weekly burden at roughly 18% of managers' time across 1,400 large organizations. That enterprise benchmark is a warning, not a small-business universal.
34. 32% of large organizations report frontline system failures every week.
At 32%, a system failure is not a rare incident. It is part of the weekly operating rhythm for nearly one-third of the large organizations surveyed. Workarounds, duplicate entry, and reconciliation are plausible consequences, but UKG did not quantify them in this finding. Use it as an enterprise risk signal, not a universal failure rate.


35. The U.S. Department of Labor recovered more than $259 million for nearly 177,000 workers in FY2025.
The recovered total is large; the denominator makes it human. Simple division gives roughly $1,460 per affected worker, although individual amounts vary widely. The Wage and Hour Division’s fiscal-year result was its highest since 2019. It counts money found and recovered through enforcement, not every unpaid dollar in the economy.


36. UKG and KPMG frame employee pay as 40% to 60% of operating expenses at many large organizations.
Payroll controls sit on top of one of the largest cost bases in an organization. That is why a small error rate can become material. The 2026 UKG and KPMG payroll study uses 40% to 60% as report context, not as a measured survey response. The survey itself covered 319 senior payroll leaders at multinationals with at least 10,000 employees and $5 billion in revenue.
37. Payroll leakage is estimated at 2% to 4% of total labor spend.
Two percent sounds like rounding noise until it touches a payroll budget. Applied illustratively to $10 million in labor spend, the reported range becomes $200,000 to $400,000. That is arithmetic, not an audited forecast for your company. Test the UKG/KPMG estimate against local corrections, rework, system limits, and consistent time-rounding rules.


38. 38% report $1 million to $5 million in annual payroll losses.
Nearly two in five respondents placed annual payroll losses in a seven-figure band. The scale is inseparable from the headline: every surveyed organization had at least 10,000 employees and $5 billion in revenue. This shows how material payroll failure can become in a multinational, not what a small company should expect to lose.
39. 74% use more than two vendors to manage global payroll.
“More than two” means at least three providers touching one global process. International payroll may require that complexity. The control risk appears when definitions drift, records are re-entered, or ownership ends at each vendor boundary. A payment can be locally correct and still emerge from a globally fragile chain.
40. Payroll control remains uneven: 35% measure first-time-right payroll, while 33% operate a standardized global model.
These are two different control gaps, not pieces of one fraction. First-time-right asks whether payroll is correct before repair. Global standardization asks whether countries use a common operating model. Both are minority practices in the same respondent group, but 33% is neither a subset nor the remainder of 35%.

Tighten the handoff to payroll: calculate shifts and overtime, document corrections, remind people before close, approve the record, then lock the period.
The evidence argues for a record, not a surveillance system
The evidence does not say “collect everything.” It says something more useful: work is easy to lose, coordination is expensive, and weak inputs become expensive outputs. A trustworthy system asks for the smallest useful record - project, duration, and enough context to understand the entry - then uses reminders, approval, and locking to keep that record complete. The result should support billing, payroll, and project decisions. It should never score how convincingly someone performed busyness.
Methodology, limitations, and reuse
Sources were checked on August 10, 2026. For every finding, we recorded the publication date, data period, geography, sample, denominator, study type, sponsorship, exact claim, and material caveat. Qualifiers are evidence too: when a source says “nearly” or “more than,” we keep that language unless it also publishes the exact value.
Important boundaries: the 2025 BLS release is based on about 6,100 interviews and has a shutdown-related diary gap that BLS says may have affected estimates; Microsoft’s two-minute and 275-interruption figures use different windows and a high-notification cohort; Gallup’s $10 trillion is modeled; ADP and Visier are self-reported; DOL recoveries are enforcement results, not total wage-theft prevalence; and UKG/KPMG enterprise findings are not universal small-business benchmarks. Asana and Atlassian research is vendor-sponsored. None of these caveats makes the findings useless. They define the claims you can safely make.
You may quote, screenshot, or link directly to the charts with attribution to the original source and this page. Every SVG has accessible metadata, a visible source note, and a stable URL. The shortest defensible citation still needs four things beside the number: source, population, period, and caveat.
Copy-ready page citation: Sandtime.io Editorial Team. “40 Time Tracking Statistics for 2026.” Sandtime.io, updated August 10, 2026. https://sandtime.io/blog/time-tracking-statistics-2026.
What is the most important time tracking statistic for 2026?
Choose by decision, not shock value. For operations, the 60% “work about work” finding exposes coordination cost. For culture, ADP’s surveillance associations matter. For finance, 2-4% estimated enterprise payroll leakage shows why inputs and controls deserve attention.
Do these statistics prove that time tracking improves productivity?
No. They document work patterns, friction, perceptions, and financial risks. Better records can improve decisions; they do not manufacture productivity. A useful process reduces reconstruction without adding disproportionate administration.
Does employee monitoring improve productivity?
The evidence is mixed. GAO found positive and negative effects across 122 studies that met its methodological standards, while ADP found worse self-reported outcomes among people who felt constantly watched. The purpose, implementation, and worker experience matter.
Can I cite these charts in a report or presentation?
Yes. Link to the stable topic anchor or direct SVG and credit the original source. Keep the population, period, denominator, and caveat with the number.
Are the payroll figures relevant to small businesses?
They show how material payroll controls can become, but the UKG/KPMG sample consists of very large multinational organizations. Do not project its percentages directly onto a small business without local data.
How often will this page be updated?
We update a finding when its original source publishes a comparable replacement or when a material correction is needed. Stable topic anchors keep existing citations working even when the source year or value changes.
About the contributors


Przemysław Zalewski
Sandtime.io engineer and Sanddev team member who reviews product accuracy, technical details, sources, and editorial quality.
LinkedInEmailSanddev profile